
Introduction to Technical Analysis in Cryptocurrency Trading
Table of Contents
“Patterns don't work 100% of the time. But they are still critical because they help you define your risk. If you ignore patterns and focus on hunches, feelings, and hot tips, just forget about achieving consistency.” -Ifan Wei
What is meant by technical analysis?
Technical analysis uses past price charts and market data to analyze and forecast changes in the value of securities in the financial markets. It is predicated on the notion that a trader may forecast future price trajectories with some degree of accuracy provided they can recognize past market patterns.
What is the purpose of technical analysis?
Technical analysis paves the way for rule-based trading while assisting you in organizing the big picture of the market. It will be crucial to use a technical approach, particularly in the beginning when you are trying to establish your own trading style.
1.The likelihood of a market trend continuing is higher than that of it changing.
You only need to glance at any pricing chart to see this. Naturally, the goal of any trader is to be aware of the general direction of the market, to latch onto the dominant trend, and to benefit from it through trading.
2. Discounting processes are seen in markets.
To put it another way, technical analysts work under the premise that pricing already reflects market fundamentals, so everything you see on the charts is a reflection of any fundamental factor influencing the market. With the advent of instant messaging, this is more true than ever.
A trend's unidirectional price movement or the market's quick response to any fresh fundamental data point to the idea that markets reflect human behavior. We may infer from the aforementioned premises that technical analysis seeks to depict and quantify the human psychology that is always at work in the markets.
3. Historical events are likely to recur.
This third premise is predicated on the idea that human psychology and behavior are constant, and that pricing will always reflect this by reoccurring specific patterns and trends in price movement.
As a consequence of human decision-making, price action might be regarded as intentional. Even though some people think that price movement is entirely arbitrary and unexpected, technical analysts are constantly able to recognize and measure such patterns of behavior by looking at previous markets. Market players are generally thought to follow certain routines that are seldom changed, despite the fact that markets are fundamentally unpredictable.
What is the importance of technical analysis in cryptocurrency trading?
Technical analysis in cryptocurrency trading has a number of benefits.

1.Pay Attention to Price Changes:
By focusing on price fluctuations and patterns rather than on subjective variables, it offers an objective perspective of the market.
2.Perspectives on Industry Trends:
By identifying market patterns, technical analysis assists traders and investors in identifying profitable opportunities and making well-informed decisions.
3.Risk Control:
Technical analysis helps with risk management by proposing possible entry and exit locations for trades by identifying levels of support and resistance.
What are the basics of technical analysis?
Types of Stock Chart Patterns
Continuation Patterns
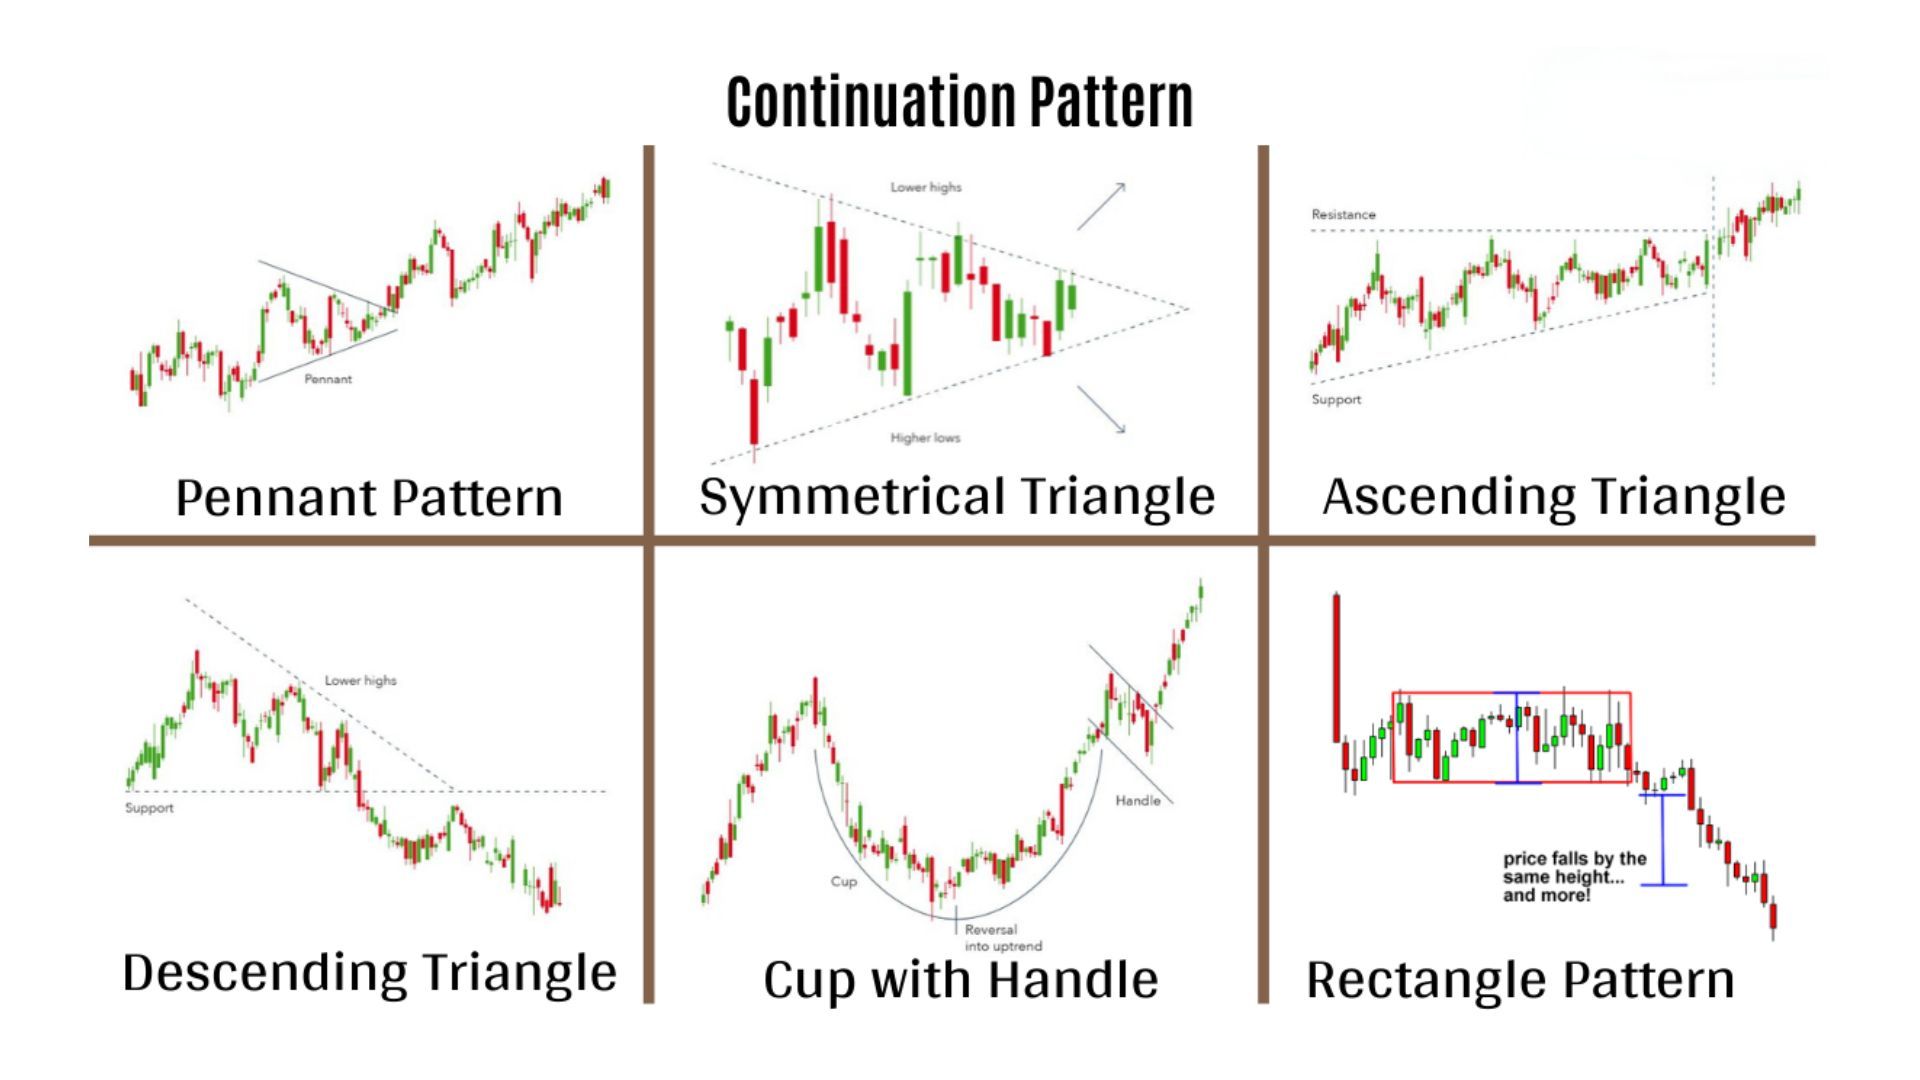
One may think of a continuation pattern as a break in a dominant trend. This is the time during an upswing when the bulls regain their breath, or during a decline when the bears temporarily ease up. It is impossible to predict if a trend will continue or turn around when a pricing pattern is developing. Therefore, it is crucial to pay close attention to the trendlines that were used to create the price pattern as well as if the price breaks above or below the zone of continuation. Unless a trend is clearly reversing, technical experts usually advise thinking it will continue.
Reversal Patterns
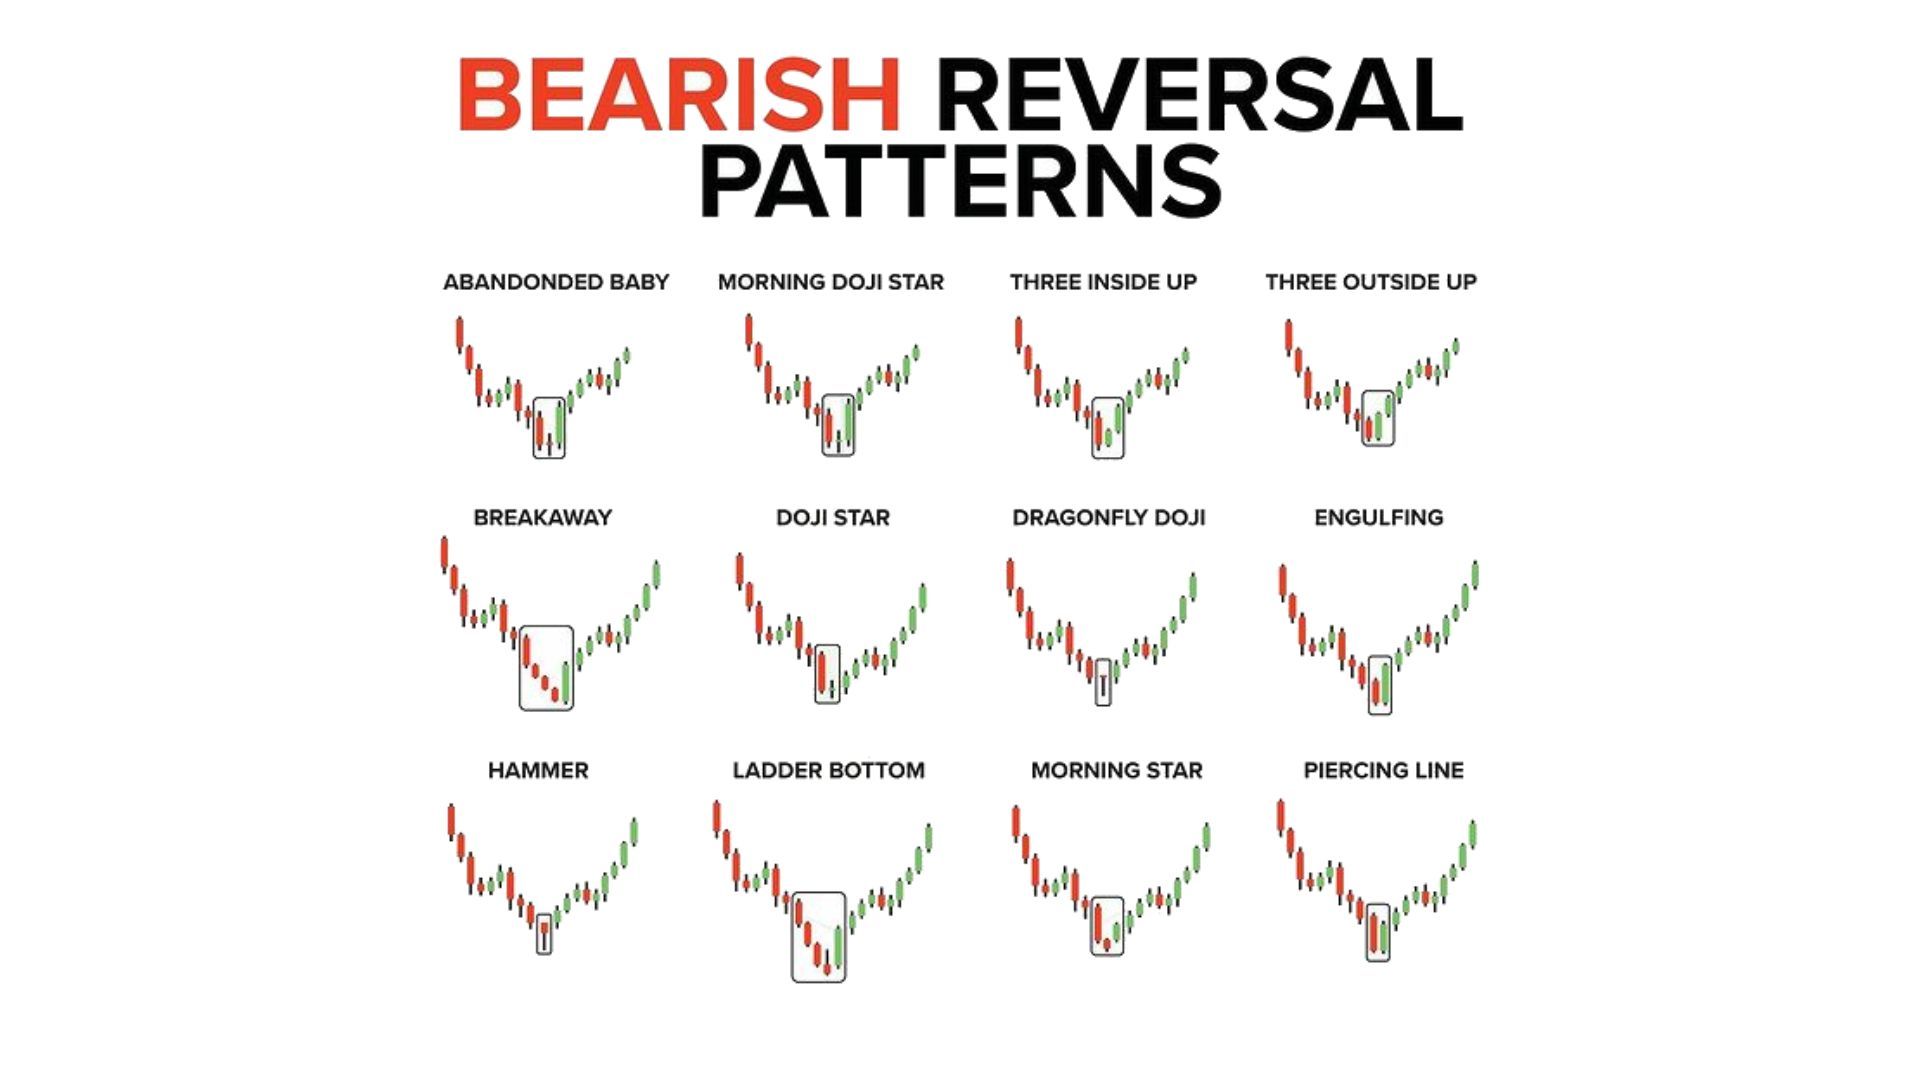
A reversal pattern is a pricing pattern that indicates a shift from the current trend. These patterns indicate times when the bears or bulls have peaked. The current trend will halt and then shift when fresh momentum from the opposing side (bull or bear) arises.
For instance, an upswing fueled by bullish exuberance may stall, indicating equal pressure from the bulls and bears, before finally ceding ground to the bears. As a result, the trend shifts to the negative.
What are the interpretations of price movements in technical analysis?
A trading discipline called technical analysis is used to assess investments and spot trading opportunities in price movements and patterns on charts.
According to technical analysts, historical trading activity and price fluctuations of an asset might serve as useful predictors of future price movements.
In technical analysis, price movements are believed to follow trends. This indicates that once a trend has been formed, it is more probable that prices will move in that way going forward than the opposite. This is the underlying premise of the majority of technical trading methods.
What are crypto indicators?
You may do a thorough examination of the market by employing crypto indicators. Which ones are the most well-liked then? You have access to a number of useful charting tools, such as trend lines, support and resistance levels, and candlestick charts.
Candlestick charts
Candlestick charts are among traders' most popular tools. They are excellent for getting a better understanding of the general behavior of the market. It display the opening and closing prices in the timeframe you have selected for analysis, which can range from a day or a week to a few hours or even minutes. They also indicate the highest and lowest price points of the cryptocurrency charts.
Trend lines
Since historical patterns form the foundation of crypto technical analysis, it is critical to comprehend this element. Please keep in mind that past successes are not always a guarantee of future success. One of the clearest crypto indications is a trend line, which is made by drawing a single line that connects the many high and low price points. In the end, the stronger the trend and the easier it is to recognize and target possible future market trends, the more price points you link.
Levels of resistance and support
Support and resistance levels, which show the locations of previous market peaks and troughs, may be useful crypto indications for determining the best times to enter and exit the market. When a market exhibits indications of a directional trend or is range trading, trend lines can be useful in interpreting the data. Fibonacci expansion and retracement levels are frequently used by traders to assist them identify levels that the trend may target or where a reversal pattern may occur.
The core problem, however, is the need to fit markets into a style of trading rather than finding ways to trade that fit with market behaviour.” - Brett Steenbarger
Bottom-Line
The technique of predicting future prices via chart patterns and indicators is known as technical analysis. Along with line, bar, or candlestick charts, some of the most used indicators include moving averages, RSI, and Bollinger bands. Risk management, price movement analysis, and chart trend knowledge are a few advantages.


